
Amazon SP-API solution area · KEYXE Seller Analytics
Seller Operations, Explained with Clarity.
KEYXE is developing reporting workflows for authorized Amazon seller information, from sales and orders to inventory, catalog and financial reporting. The goal is to make operational questions easier to explore through well-defined metrics and permission-aware interfaces.
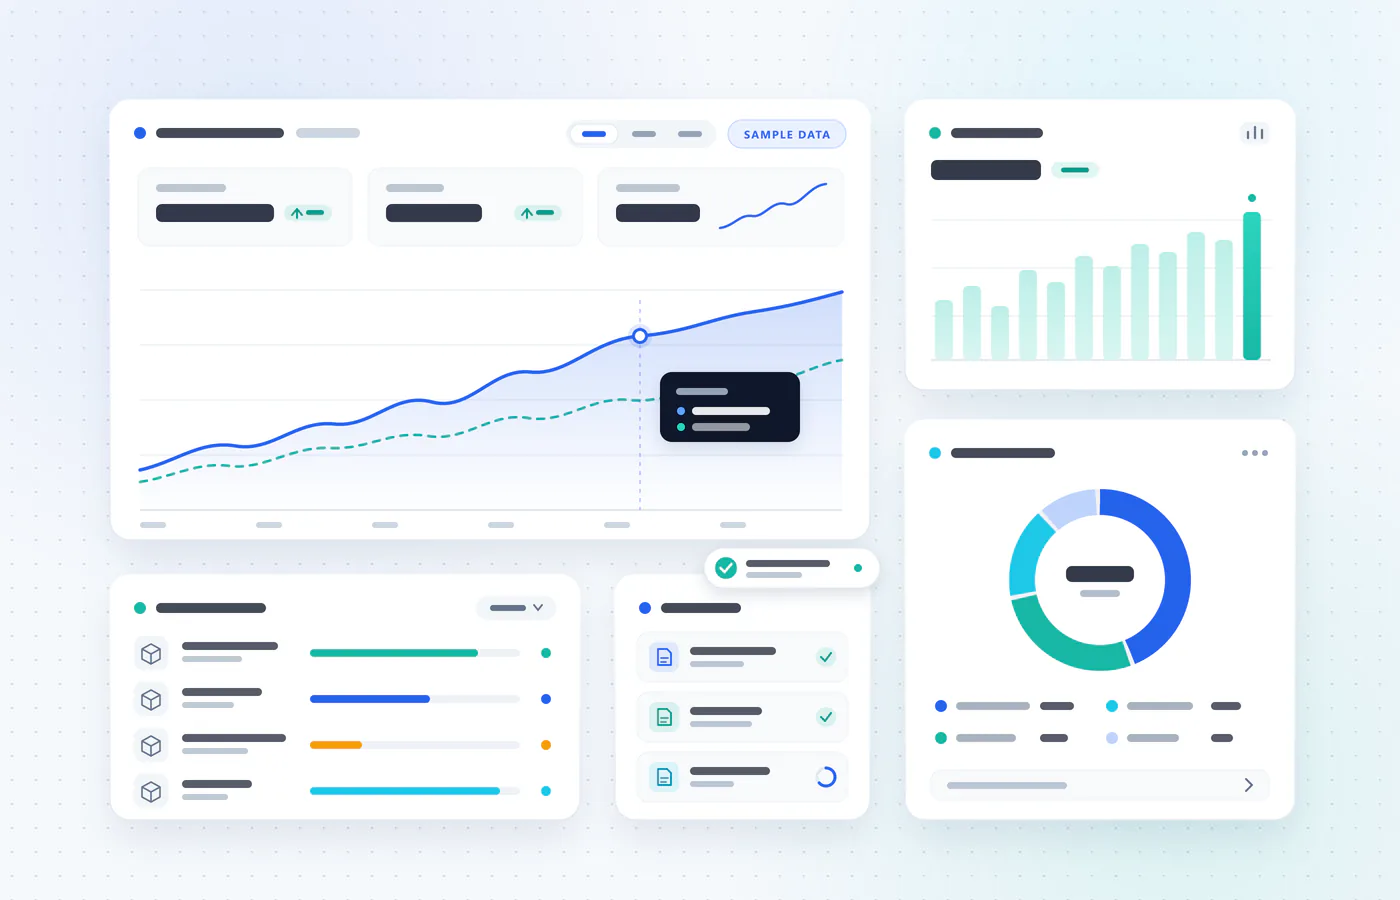
What works today: every panel on this page is an interactive demonstration on fictional data. What depends on approval: live seller data requires an approved SP-API application, the applicable roles and the seller’s authorization. Certain reports are role-, marketplace- and account-dependent.
KEYXE Seller Analytics · 01
Sales & Traffic
Planned source: the Reports API sales and traffic report, requested asynchronously for an authorized seller and marketplace. KEYXE would organize daily ordered sales, units, sessions and page views by product and date.
Questions it helps answer
- Which products drove the most ordered sales in the last 30 days?
- Did unit session percentage change after a listing update?
- How do weekend and weekday sales compare by marketplace?
Ordered product sales = Σ (units ordered × item price) for the period. Unit session percentage = Σ units ÷ Σ sessions, calculated from period totals — never by averaging daily percentages. Sessions are visits, not unique people. Ordered sales are not settled revenue.
KEYXE Seller Analytics · 02
Orders & Reports
Planned source: the current Orders API (v2026-01-01) for order counts, statuses and fulfillment channel, without buyer name, address or contact fields, plus asynchronous order reports for history.
Questions it helps answer
- How many orders are pending or unshipped right now?
- What share of orders were canceled this month?
- Can I export last quarter’s order counts by day?
Orders are counted once per order; units can be higher. Status is shown as of the data time. Canceled orders are kept visible rather than silently removed.
- Shipped14,436 · 93.0%
- Unshipped514 · 3.3%
- Pending274 · 1.8%
- Canceled294 · 1.9%
This demonstration contains no real customer or buyer data.
KEYXE Seller Analytics · 03
Inventory
Planned source: FBA inventory summaries for available, inbound, reserved and unfulfillable quantities, and inventory ledger reports for receipts, shipments, returns and adjustments.
Questions it helps answer
- Which products are below two weeks of estimated cover?
- How much stock is inbound versus available?
- What explains the change in stock over the last month?
Estimated days of cover = available units ÷ average daily units over the last 30 days. It is a simple estimate, not a forecast; zero recent sales shows N/A.
3 of 24 sample products are below 14 days of estimated cover (available units ÷ average daily units over the last 30 days).
KEYXE Seller Analytics · 04
Catalog & Finance
Planned sources: Catalog Items and Listings Items (read-only) for product context and listing issues; the Finances API (v2024-06-19) and settlement reports for fees, refunds and settlements.
Questions it helps answer
- Which listings have open issues?
- How did fees and refunds change between settlements?
- What does a gross-to-net view look like for one product?
Gross-to-net starts from ordered sales and subtracts refunds and fees from financial events. Cost of goods is entered by the merchant — Amazon does not supply it. Settlement timing differs from order timing and requires reconciliation.
Breakdown and assumptions
- Ordered sales: $499,803.31 from synthetic seller rows (last 30 sample days).
- Refunds: fictional 3.5% of ordered sales.
- Referral fees: fictional 15% of sales after refunds — not an Amazon fee schedule.
- Fulfillment: fictional flat amount per unit.
- COGS: entered by a merchant in a real workflow; Amazon does not supply cost of goods. Here it is a fictional 32% of sales.
- Real settlements are recognized on different dates from orders and need reconciliation; this is an illustration, not accounting.
What KEYXE Seller Analytics does not claim
- Unrestricted buyer personal data — restricted roles are not requested
- Brand Analytics for every account — only eligible brand owners with the applicable role
- Vendor (first-party) coverage — not in scope today
- Real-time data — reports are produced asynchronously and labeled with “as of” times
- Final accounting profit — financial views are reporting aids, not bookkeeping
- Write access on day one — listing or catalog changes are not planned for the initial scope
Brand Analytics, for eligible brands
For sellers enrolled as brand owners, Amazon offers Brand Analytics reports such as search query performance. KEYXE plans to support these only for eligible accounts that grant the applicable role.
Not yet approved by AmazonSee the SP-API integration page for the planned API families and role requirements.
Explore the seller workspace.
Choose a marketplace and period, inspect the chart, open a formula and export the synthetic CSV.